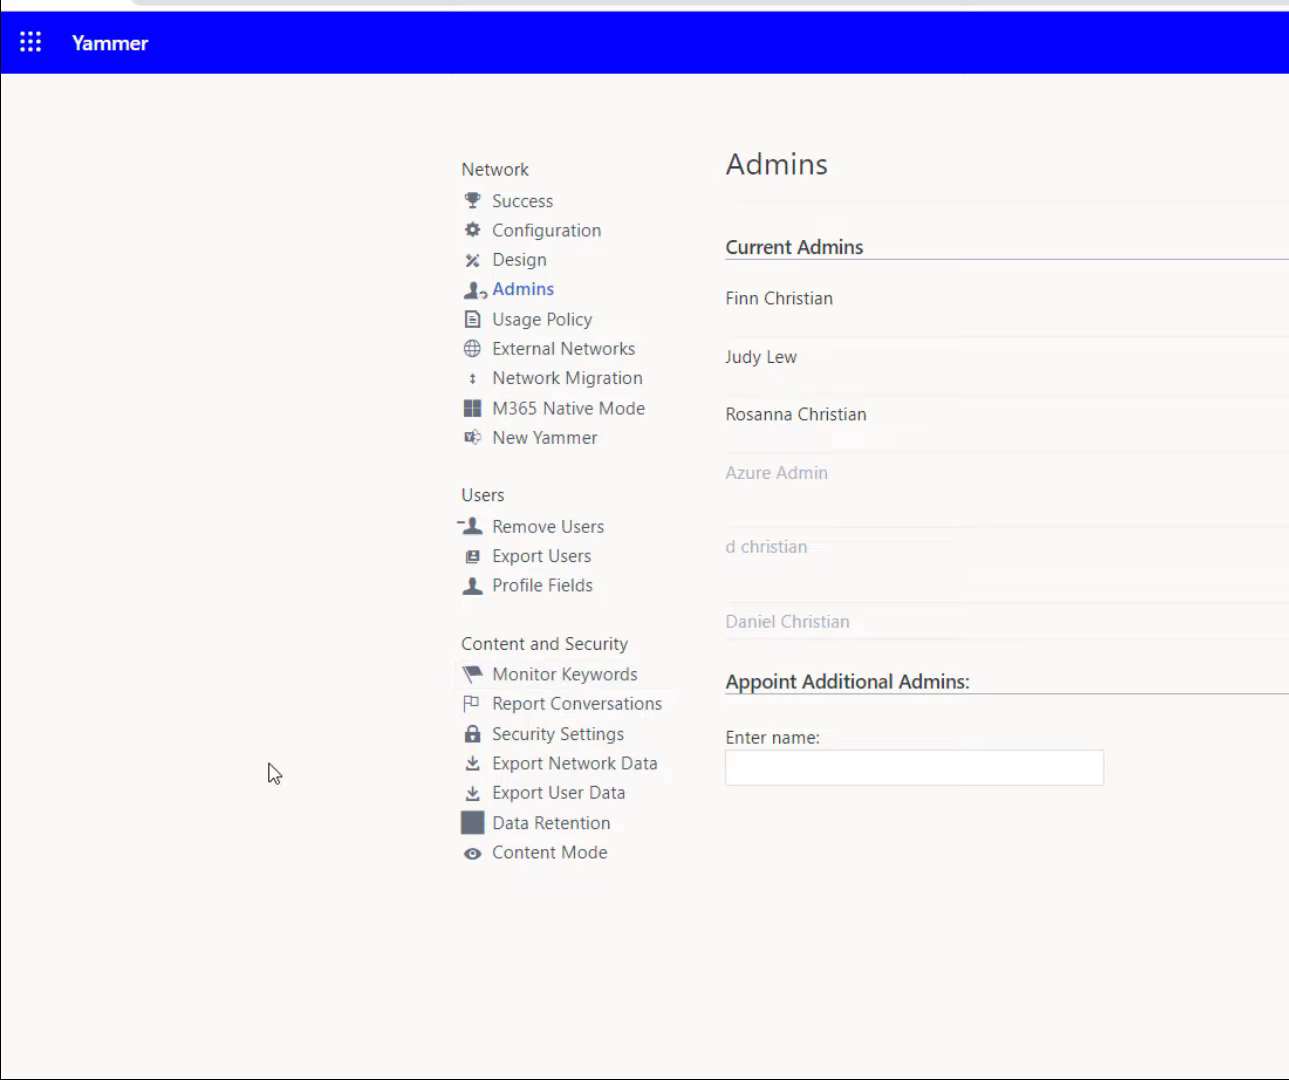
Yammer, an esteemed platform for fostering social connections within enterprises, fosters effortless communication among team members, opening pathways to heightened efficiency and participation. Nonetheless, the importance of proficient oversight cannot be overstated in order to fully capitalize on its advantages, guaranteeing a safe, organized, and orderly utilization.

Unlocking Effective Management of Yammer Communities